The Ulam Spiral, conceived by mathematician Stanislaw Ulam in 1963 during an otherwise dull meeting, was born from a simple act of doodling numbers in a spiral while highlighting prime numbers. The resulting patterns captivated mathematicians, including Martin Gardner, who later published their findings in *Scientific American*. This intriguing visual representation continues to spark curiosity among enthusiasts because it transcends mere numerical analysis to reveal deeper relationships within the prime numbers.
The Origins of the Ulam Spiral
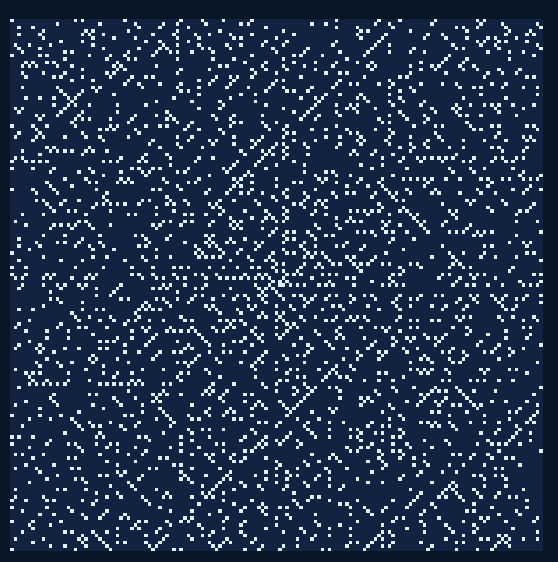
Ulam’s illustration may have started as idle creativity, but it uncovered fascinating patterns. By placing the number 1 in the center and spiraling outward, with primes circled, distinct diagonal lines emerge over a sufficient number range. This process isn't just visually striking; it also offers an engaging way to visualize how primes cluster in certain areas and spread out in others. Such patterns provide a deeper insight into number theory and hint at the enigmatic nature of prime distribution, which has puzzled mathematicians for centuries.
Creating the Ulam Spiral in R
To generate this visual, we can utilize a function written in R. The setup allows customization, including the size of the grid and different visual themes. The initial configuration revolves around an odd-sized grid to maintain symmetry. This is significant, not just for aesthetic appeal, but to ensure the mathematical integrity of the spiral's structure. If you're working in this space, ensuring your grid is properly sized sets the foundation for accurate prime representation.
ulam_prime_spiral <- function(
n = 51,
theme = c("Cosmic", "Blueish", "Classy", "Psycho"),
show_nums = FALSE,
animate = FALSE,
speed = 1,
verbose = TRUE
) {
theme <- match.arg(theme)
if (n %% 2 == 0) { n <- n + 1L }
if (n < 5) stop("Size must be > 5.")
total <- n^2
mid <- (n + 1L) / 2L
mat <- matrix(0L, n, n)
...
}
The function begins by determining positions and directions for filling the spiral, gradually populating a matrix with integers as it advances in a defined path. The use of a Sieve of Eratosthenes algorithm effectively identifies primes within the generated matrix. The sieve method, cherished in number theory, allows for an efficient way to pinpoint primes without resorting to brute-force checking of each individual number—making it a natural choice for this application.
is_prime <- rep(TRUE, total)
is_prime[1] <- FALSE
p <- 2L
while (p * p <= total) {
if (is_prime[p])
is_prime[seq.int(p * p, total, p)] <- FALSE
p <- p + 1L
}
Visual Themes and Features
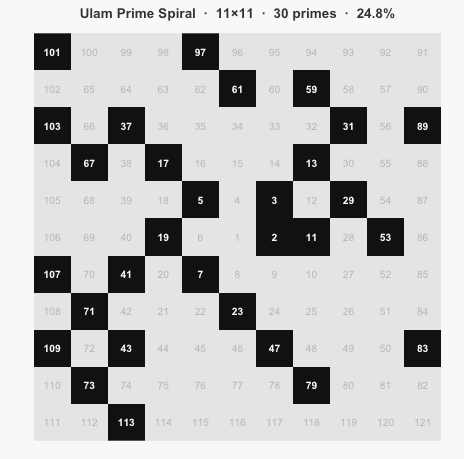
Users can choose specific visual styles such as "Classy" or "Psycho" when displaying the Ulam spiral. Such choices allow for personalization and can even lead to different interpretations of the visual data. For example, one theme might lend itself to a more traditional aesthetic, while another could provoke a modern interpretation of prime distribution. Additionally, for smaller grids, it’s possible to visualize the actual numbers alongside the primes. This feature enhances engagement and understanding of the distribution of primes, putting them into a relatable context that is often missing in pure number theory.
The complete implementation of this function is available on GitHub. For those looking to deepen their R programming skills or enhance data visualization techniques, exploring the Ulam Spiral can serve as both an educational tool and a source of inspiration for mathematical art. The ability to visualize data reveals complexities often hidden in pure numbers, bridging the gap between analytical rigor and artistic expression.
Implications and Future Outlook
What we're seeing here is more than just a fascinating number pattern. The Ulam Spiral stands as a testament to how mathematical inquiry can evolve from the simplest of beginnings. As mathematicians and programmers continue to explore such visuals, we might find new avenues in number theory, particularly regarding prime identification and distribution. The intersection of programming and mathematics might also inspire a new generation of data scientists to consider mathematical constructs not only as abstract formulas but as visual properties that can unlock further understanding.
Access the full code in the Useless_R_functions repository on GitHub, where you can also find updates and related R functions. Dabble in it—who knows what patterns you might uncover yourself?
Happy R-coding!